|
|
Dyop® - Dynamic
Optotype™ Helping the world see clearly, one person
at a time. |
|||||||||||

|
Introducing the Dyop® The “Revolutionary” Method for Measuring
Visual Clarity (Acuity)
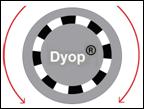
A Dyop®
(pronounced “di-op”) is a calibrated segmented spinning ring visual target
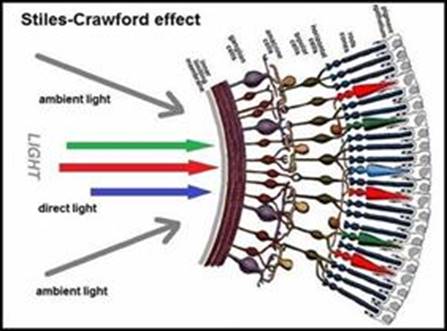
(optotype) which helps doctors (and you) test how clear your vision is. A Dyop provides a strobic stimulus to
the photoreceptors in the center rear area (called the fovea) of your eye’s
retina. A Dyop test is better
than previous vision test methods using letters (the Snellen “Big E” test) or
static shapes because it is based on how your eyes actually work, rather than
how well you recognize culturally-dependent letters influenced by where
you're from or how much you've practiced.
Using a Dyop makes vision tests simpler, more precise, and more
consistent. Vision is
a dynamic process inherent in all animals.
The world we see is dynamic, NOT static. Our eyes function as biological machines to
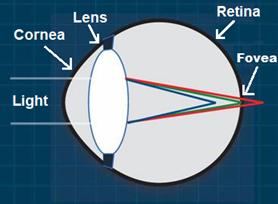
enable us to detect motion, distance, and colors so that we can detect
predators and game and eat rather than be eaten. The eye
functions much like the pixels of light you are likely seeing as you are
reading these words. Those visual
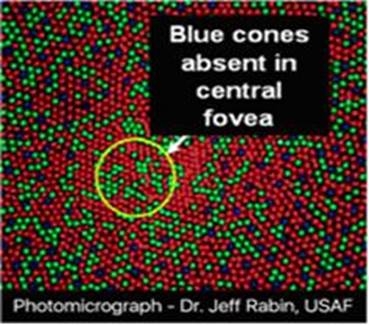
pixels are composed of the Red, Green, and Blue light-receptive
cone-shaped photoreceptors in the central rear area of your retina
called the fovea. The color
stimulus of those cone-photoreceptors, and their proximity to each other,
creates the panoply of colors that are registered as images in your brain. Because vision is an automatic process, our
brain learns to be oblivious to the stimulus of those individual pixels of
light. = = = = = = = = = = = = = = = = = = = = = = = = = = = = = = =
= = = = = = = = = = = = = = = = = = = = = = The
Components of the Eye
Basic Online Dyop
Acuity Test https://www.dyop.net/documents/Dyop_acuity_screening.gif Basic
Online Dyop Color Screening Test Basic
Dyop Blue Green Visual Screening Test Smartphone
Online Dyop Color Screening Test Smartphone
Dyop Blue Green Visual Screening Test Dyop Presentation 2024 https://www.dyop.net/documents/Dyop-Presentation_2024.mp4 Click here for the “How We See” White Paper and Dyop research
articles. Click
here for “A History_of_Visual_Testing_and_Optotypes” and why even Snellen thought there were flaws in his
Optotypes. = = = = = = = = = = = = = = = = = = = = = = = = = = = = = = =
= = = = = = = = = = = = = = = = = = = = = = How
Acuity Works
The
properties of visual clarity (acuity) are the SIZE of the image being
observed, the VIEWING DISTANCE to that image, and the ability of the
visual system to PROCESS THAT IMAGE as clearly as possible (Resolution
Acuity). For vision to be
effective and efficient that perception also needs to be autonomic, so that
we are totally unaware of the process, otherwise you would be seeing the Red, Green, and Blue pixels on
your screen instead of the white background and the black areas where the
pixels are NOT emitting light. The
current global “standard” for measuring vision was developed in 1862 by
Dutch Ophthalmologist Herman Snellen, based upon Recognition Acuity,
and the cultural ability of Europeans to detect the size and differences
between static letters such as “E” and “C.” However,
vision is actually a RESOLUTION Acuity
process. HOWEVER, vision only becomes RECOGNITION
Acuity as we learn to interpret visual stimuli. Treating vision as a RECOGNITION
process (using Snellen letters) may be “convenient” but it inherently
misses the functionality and underlying processes of vision. Classical (“Big E”) static
letter-based Snellen vision tests also use a theoretical (and assumed)
stimulus height (the Minimum ARC of “Resolution”) of 1.0 arc minutes
high which is mistakenly followed by the Eye Care Profession, ignoring the
fact that that letters have a stimulus-based AREA rather than just a Height. The eye sees images on a two-dimensional
basis, rather than one dimensional.
The conceptual mistake made by Snellen was that he assumed that the Minium
AREA of Resolution was actually 1.0 arc minutes squared. That letter-based Snellen stimulus of 1.0
arc minutes squared area is larger than the empirically derived Dyop 0.54
arc minutes squared actual Minimum AREA of Resolution. That Dyop stimulus AREA corresponds
to a cluster of about 20 cone-photoreceptors. The Snellen static MAR correlates
to a cluster of about 40 photoreceptors, which contributes to it being
inherently imprecise. Because vision is a dynamic process,
using Recognition Acuity and static targets to measure
vision, also depletes the response of the photoreceptors, and tends to
produce an overminused (excess spherical power) refraction. See the comments and research articles
about the Global Epidemic of Myopia (below). Even
Snellen had significant reservations about the acuity test he developed for
the benefit of the Eye Care Profession.
A_History_of_Visual_Testing_and_Optotypes Using a Dyop allows us to determine that the measured Snellen
stimulus AREA is too large,
resulting in the 1862 Snellen “standard of vision testing” being inherently
inaccurate, inconsistent (because the stimulus letters are NOT
consistent), and inefficient (because of the extra time to recognize
and identify the Snellen visual stimulus). Snellen testing inherently mistakes
cognition for acuity. The
improperly and imprecisely “measures” vision, is culturally biased, and is
dependent upon the subject having letter-based literacy. Cognition of European-type letters-based
letters becomes a guessing game for both the doctor and patient and measures
conceptual processing by the patient as much as it does visual clarity. The Snellen excess area stimulus gap
creates a logarithmic pattern where increases in the height of the letter
doubles with increases of diopters of visual blur. That logarithmic increase (aka, LogMAR)
is as much a measure of the inherent error of Snellen testing as it is
of acuity. The other delusion of Snellen is
that we DO NOT see black as a stimulus color. Snellen assumed that static letters such as
“E” and “C,” could use the detection of the size and differences between
those letters and accurately measure acuity and refractions. Letter-based vision tests use an assumed
stimulus gap area (the Minimum AREA of Resolution - MAR)
of 1.0 arc minutes squared.
That Snellen letter-based 1.0 arc minutes squared stimulus AREA is
almost twice the size of the empirically derived 0.54 arc minutes
squared Dyop Minimum AREA of Resolution
based on the actual physiological response of the eye. With “Big E”
letters what we really “see” (as a stimulus) are
the white gaps around the letters so that the Snellen estimated
stimulus AREAS are actually twice the size of the empirically Dyop
Minimal AREA of Resolution stimulus and inherently imprecise. Snellen created the term “optotype”
to describe a visual target for use in measuring acuity because new
technology requires new terminology. As
a homage to Snellen, I am describing the “20 cone-photoreceptor cluster” of
the Dyop Minimum AREA of Resolution as a “Bailey Cluster.” It is a homage to Dr. Ian Bailey who
created the LogMAR concept to explain away the abnormal logarithmic,
doubling increase in the Snellen optotype height due to the bloated estimated
minimum stimulus AREA.
Similarly, I am calling the optimum 10% stroke width and 40 rpm
rotation rate a “Colenbrander Dyop.” It was THE Dr. August Colenbrander
who suggested adjusting the Dyop stroke width and rotation rate to determine
the results of those effects by calling.”
Dr. Colenbrander also supervised the 1984 meeting which established
the Snellen test as the “global standard” for vision. https://www.dyop.net/documents/1984VisualAcuityStandards-highlighted.pdf From that 1984 document are the words, “XIV.1 A standard is
meant to be a stable entity, yet all points are not established by
experimental certainty, deficiencies are periodically revealed and need
correction, new developments in tests are occurring, etc. Thus, a standard may be an evolving
document and needs to be re-viewed periodically and should not be regarded as
immutable.” = = = = = = = = = = = = = = = = = = = = = = = = = = = = = = =
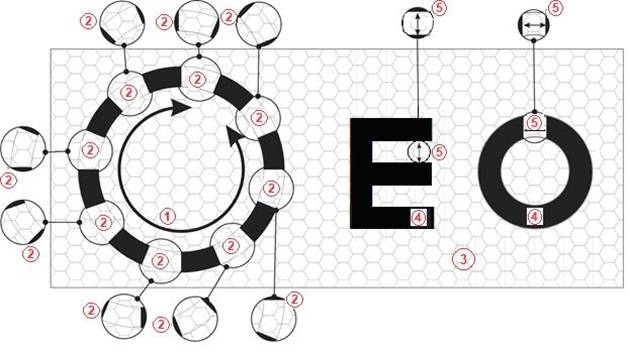
= = = = = = = = = = = = = = = = = = = = = = How a
Dyop® Works
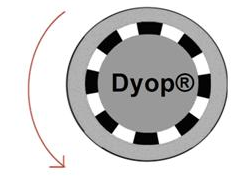
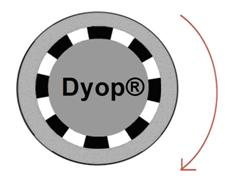
As a
spinning Dyop® ring gets smaller, the (equally sized) gaps and segments
become so small that it becomes impossible for the eye to detect the
direction of the Dyop ring rotation.
The Dyop acuity endpoint is the smallest Dyop diameter
where the rotation direction of the spinning ring can still be detected. It serves as a precise indicator of visual
clarity and vision correction. The gap
area for 20/20 (6/6) acuity of the smallest Dyop where spinning by the
Dyop ring can be detected has a Minimum AREA of Resolution stimulus gap of
0.54 arc minutes squared with a ring a diameter of 7.6 arc minutes. Dyop sub-acuity is the Dyop diameter
where the gaps are too small to detect the Dyop ring rotation. Components of a Dyop
The
use of a Black/White-on-Gray Dyop
for Resolution Acuity is
comparable to the current Snellen Black/White Recognition Acuity “global
vision standard” (the “Big E”) using letter. The
strobic stimulus of the spinning Black/White-on-Gray Dyop
gaps/segments functions as a (binary) on/off switch to stimulate those
cone-photoreceptors. A Dyop provides a
pixelized strobic photoreceptor response to create the images you are seeing
using Resolution Acuity in response to the
photoreceptor’s refresh movements. The Dyop
acuity endpoint is the smallest diameter (in arc minutes) where the
direction of spinning can be detected.
Measuring the Dyop diameter in arc minutes eliminates the cultural
bias of using Feet/Meters, insures that the Dyop diameter is collaborated
with the viewing distance, and creates a precise, accurate, and efficient
method of measuring visual acuity.
When the stimulus of the Dyop gap/segment AREA becomes
too small, it becomes a sub-acuity Dyop where the gap area is too
small to stimulate a sufficient number of fovea photoreceptors to enable
rotation detection of the spinning Dyop.
That precise acuity endpoint also creates optimum values for sphere,
cylinder, and axis and aids in avoiding an overminused refraction.
Static letter-based acuity tests are
inherently imprecise because they mistake the process of cognition for
physiological resolution processes, use an imprecise multiplicity of
inconsistent letters, and have an overly large stimulus area to benchmark vision
rather than the empirically determined smaller Dyop stimulus size. Because vision is actually a dynamic Resolution
Acuity process, using Recognition Acuity with static
targets to measure vision, also depletes the response of the photoreceptors, and
tends to consistently produce an overminused (excess spherical
power) refraction. That overminus
leads to angular elongation of the eye, increased myopia, and may indicate
that Snellen testing is a significant contributor to the Global Epidemic
of Myopia. https://www.dyop.net/documents/Snellen_vs_Dyop_Refractions-Sanni.pdf
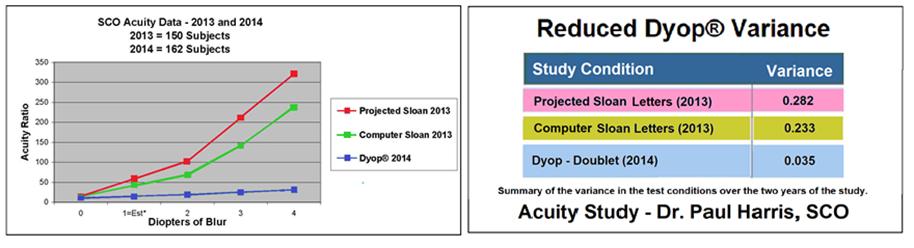
https://www.dyop.net/documents/JCOVS-21-Gordon_refraction_comparison.pdf https://www.dyop.net/documents/Guy_Barnett-Itzhaki_The_Dynamic_Optotype.pdf That increased precision of the Dyop gap
stimulus area (0.54 arc min squared) also results in Dyop acuity having a
LINEAR increase in diameter versus diopters of blur rather than the bloated
stimulus area (1.0 arc min squared) of Snellen testing which has a
LOGARITHMIC increase in letter height with diopters of blur. The excess (2x) area of the Snellen stimulus
gap creates a logarithmic pattern where increases in the size of the letter
doubles with increases of diopters of visual blur. That logarithmic increase (aka, LogMAR) is
as much a measure of the error inherent in Snellen testing as it is of
“acuity.”
The result of using Dyop Resolution Acuity
is that Dyop testing is up to six times more precise than 1862
Snellen letter-based testing (which uses the culturally dependent Recognition
Acuity of static letters or symbols), is up to eight times more
consistent, and is up to three times more efficient. A Dyop can also measure
acuity regardless of the subjects’ literacy skills or culture, easily
enables testing of children or infants, and enables measurement of acuity
in color for potential diagnostic and/or therapeutic use. The result of using Dyop Resolution Acuity
is that a Dyop is up to six times more
precise than 1862 Snellen letter-based testing (which uses the culturally
dependent Recognition Acuity of static letters or symbols),
is up to eight times more consistent, and is up to three times more
efficient. A Dyop also can
measure acuity regardless of the subjects’ literacy skills or culture, easily
enables testing of children or infants, and enables measurement of acuity
in color for potential diagnostic and/or therapeutic use. = = = = = = = = = = = = = = = = = = = = = = = = = = = = = = =
= = = = = = = = = = = = = = = = = = = = = = What Regulates Acuity As you are seeing
the images on your computer monitor, tablet, or Smartphone, or reading the
words, you think that you are seeing lines, shapes, letters, and/or
words. What you are actually seeing are pixels of
light moving rapidly across the
surface of your computer screen, tablet, or Smartphone in
combinations of the colors of Red, Green,
and Blue because those are the primary
colors that the foveal photoreceptors perceive. Those pixels of
electronic light are perceived by the color-sensitive cone photoreceptors
in the back of your retina (called the fovea) giving you
the perception of vision. The dynamic motion of
those pixels keeps the image from burning itself into the screen of the
monitor. The
automatic refresh rate of those photoreceptors (with an optimum of 0.33 arc
min squared per second) keeps the image from burning out your photoreceptor perception
and helps to keep the image dynamic.
The Dyop strobic gap stimulus also keeps those pixel images in your
screen from depleting the refresh response of the photoreceptors and thus
better enables their functioning as a biological switch sending a stimulus to
the neuroganglia.
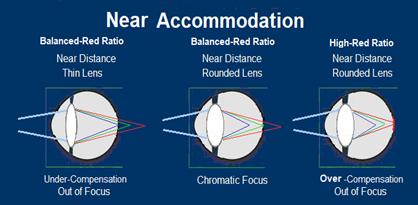
The mechanics of
vision is that when you look at an object, the biological lens in the
front of the eye changes its shape to focus that image (in a process called
accommodation) on the back center (fovea) area of the retina. For viewing
distance images, the lens is thin. For viewing near images,
the lens becomes rounded to bend the light. That accommodation
process of the lens in changing its shape keeps Visual Acuity dynamic
when you look at letters, words, lines, or shapes due to the refresh
rate of the photoreceptors. That refresh rate of the
photoreceptors is about 0.33 arc minutes squared per second (akin to the
shutter speed of a camera) provides the eye with a dynamic response to the Red, Green,
and Blue colors to
give the perception of vision.
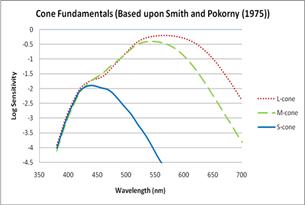
However, the colors Red, Green, and Blue each
have a disparate and distinctive focal depth where Red is
focused BEHIND the retina, Green is
focused ON the retina, and Blue is
focused in FRONT of the retina. Those focal depths provide Chromatic
Triangulation to regulate the shape of the lens of the eye and the
resulting focal depth of the image being viewed. It also enables
being able to determine the relative viewing distance to an object using just
one eye. Rather than accommodation
being regulated by the brain, accommodation is the learned response as to the
comparative focal depth for Red and Green. The
functionality of Chromatic Triangulation
can be validated by closing one eye and looking at two objects which are
almost at the same distance from you.
If visual acuity was cerebral (regulated by the brain rather than by Chromatic
Triangulation}, you would see those objects as 2-dimensional images and
with almost no depth perception, necessitating binocular vision to have that
depth perception. Instead, regardless
of which eye is closed, you almost always can tell which object is closest.
= = = = = = = = = = = = = = = = = = = = = = = = = = = = = = =
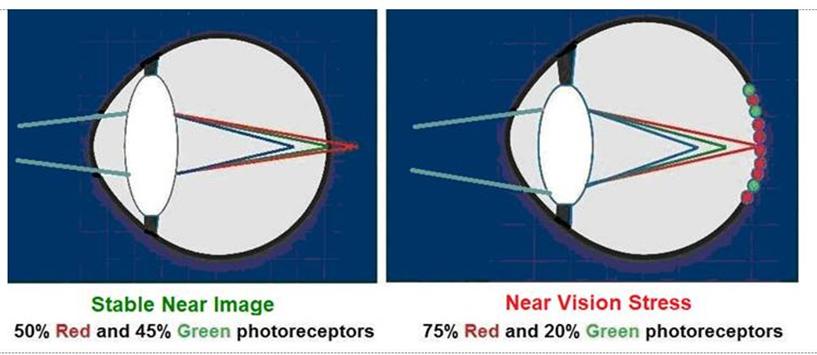
= = = = = = = = = = = = = = = = = = = = = = HOW YOU
SEE is primarily affected by the ratio of
the Red vs. Green color-sensitive
photoreceptors in the fovea of your eye, and Acuity is NOT regulated by the
brain but rather by the interaction of the retina and the biological lens. The eye evolved
about 300,000 years ago primarily with a higher ratio of Red/Green photoreceptors (75%
Red and 20%
Green) which provides a more Stable
Distance Image
enabling humans to be a more successful PREDATOR. That
evolutionary advantage of a more Stable
Distance Image facilitates humans being better able
to spot other predators and game so that humans could eat rather than be
eaten.
As farming became a
technical skill that reduced the need to migrate to find food, the preferred
near visual skills enabled the evolution of a more balanced Red vs. Green ratio
of photoreceptors (50% Red and 45%
Green) to provide a more Stable Near Image. That Stable Near Image eventually facilitated
the use of pictographic symbols and the development of letter-based
words and cultures that use “Western technology.” That remnant of the
higher red ratio (75% Red and 20%
Green) and a Stable
Distance Image is associated with cultures and
gene-pools which use pictographic writing. Unfortunately,
that Unstable Near Image
and Near
Vision Stress is also associated
with symptoms of dyslexia, migraines, and epilepsy. Response to colors by the biological lens Chromatic
Triangulation has Green Focused ON the
retina.
= = = = = = = = = = = = = = = = = = = = = = = = = = = = = = =
= = = = = = = = = = = = = = = = = = = = = = Disparate color perception also allows the
photoreceptors to use the constantly changing Chromatic Triangulation
of the Red, Green, and Blue focal
depths to regulate acuity. The deceptive factor of Black/White acuity
measurement is that it masks the mechanics of accommodation regulation and
enables the “pious fraud” of the Eye Care Profession that acuity is
“regulated by the brain.”
.
Much as twenty-first century digital
cameras use computerized electronic pixels to respond to colors and intensity
to create the images we see, the eye functions as a pixelized receptor of
retina stimuli to create vision and bring that image into
focus. The eye has about 100 photoreceptors merged into every
optic nerve going to the brain, however the Minimum AREA of Resolution as
empirically determined by a Dyop is 0.54 arcminutes squared which is about
the stimulus area of twenty fovea photoreceptors. = = = = = = = = = = = = = = = =
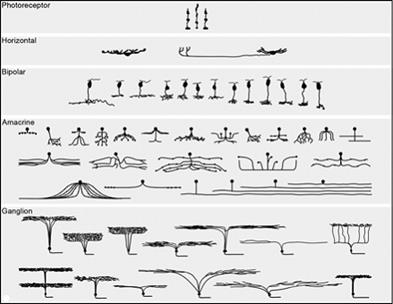
= = = = = = = = = = = = = = = = = = = = = = = = = = = = = = = = = = = = = In
his 2011 Proctor Lecture presentation Dr. Richard Masland described
retina functioning as being similar to a "biological computer" with
the photoreceptors functioning much as binary switches to create permutations
of color perception sent to the brain by the Optic Nerve Fibers and to
the Ciliary Body surrounding the lens to modulate the shape of the
lens. Cell Populations of
the Retina Cell Populations of
the Retina Retinal_cells -
Masland_Procter Lecture.pdf
Types of
neuroganglia cells
A simple
illustration of vision functioning as a dynamic process and photoreceptor
depletion is The Lilac Chaser Illusion (see below). When
you fixate on the Plus (+) in the center of the ring of Pink
circles below, you likely see the Pink circles seeming to
rotate around that Plus. But it is also likely that you
will see a single moving Green circle
which appears to spin around the Plus. The
illusion of the Green circle
appearing is because of the depletion of the Red photoreceptor
refresh resulting in the inability to “see” the color Red and
creating the illusion (delusion) that the depleted
photoreceptor area is seeing a Green circle. The
Chromostereopsis rings (below) make the contrasting blue ring appear
to move away from you or towards you as a function of cone-photoreceptor
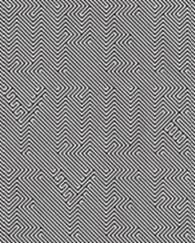
depletion depending on how long you look at it. The other two illusions (on the sides) illustrate
the creation of cognition (Open Your Eyes) even if it isn’t there, and
the refresh effect of photoreceptor depletion to create an illusion of motion
(Moving Dimple Pattern) even when it isn’t there. Typical Visual Illusions
= = = = = = = = = = = = = = = = = = = = = = = = = = = = = = =
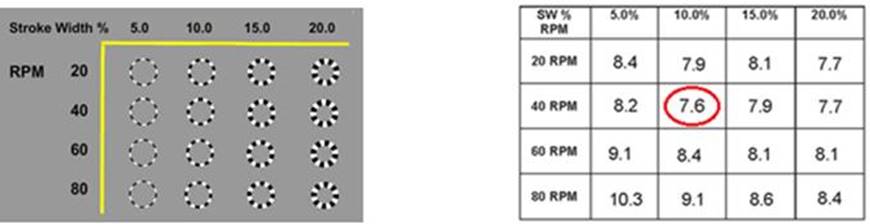
= = = = = = = = = = = = = = = = = = = = = = Quantifying the Photoreceptor Refresh Rate (and the Colenbrander optimum Dyop) The Dynamics of Visual Acuity is
provided by the refresh rate of the cone-photoreceptors located in the back
of the retina. (The following research was suggested by THE Dr.
August Colenbrander who suggested adjusting the Dyop stroke width and
rotation rate to determine the effects of those changes. That is why I am calling that optimum 10%
stroke width and 40 rpm rotation rate a “Colenbrander Dyop.”) The optimum 20/20 (6/6) acuity, using
8 uniformly spaced gaps and 8 contrasting segments, has a 10% stroke width and 40 RPM rotation
rate in maximizing the Dyop precision and accuracy. Deviation from that optimum 10% stroke
width and 40 rpm rotation rate required the Dyop diameter to increase in size
in order to be sufficient to detect the rotational motion.
That
photoreceptor refresh allows the neurons on the inner
surface of the retina to act as the equivalent of a biological circuit
board. That “optimum Dyop” with a 10%
stroke width and a 40 RPM rotation rate creates a 0.54 arc minutes squared
stimulus area (Minimum Area of Resolution – MAR)
and a 0.33 arc minute square per second refresh rate for the
color-receptive cone-photoreceptors.
It
also allows the concept of the “optimum Dyop” to avoid the “curse of Snellen
refractions” of making it easy to over-minus or under-minus a
refraction. As the Sphere, Cylinder,
and Axis values are changed, the corresponding minimal Dyop diameter detected
as spinning changes. However, as the
corresponding Dyop diameter moves towards the optimum diopter or axis value
the Dyop diameter decreases until it reaches that optimum minimum. As it goes past the optimum diopter or axis
value, the minimum diameter increases, thus precisely and efficiently defining
the optimum value as the acuity endpoint for Sphere, Cylinder, and Axis. That
smallest Dyop gap/segment stimulus area detected spinning is the
minimum visual stimulus threshold area (Minimum AREA of
Resolution – MAR of 0.54
arc minutes squared) correlates to about 20 photoreceptors. That
threshold is significantly more precise, consistent, and efficient than
staring at letters since below that stimulus diameter you have a sub-acuity
Dyop where spinning cannot be detected. The actual direction of
Dyop spinning is irrelevant. The detection of spinning also lets
the Dyop test be used for individuals who “can’t read,” infants and
young children, and individuals with letter-processing problems such as
dyslexia. The following is a
“proof of concept” test for use of measuring infant acuity. https://www.dyop.net/documents/Dyop_Infant_Acuity_Measurement_Poster.pdf = = = = = = = = = = = = = = = = = = = = = = = = = = = = = = =
= = = = = = = = = = = = = = = = = = = = = = Why We See in Color Until now, how we see, and how our eyes
adjust its visual focus, has remained a mystery. Much like the inherent LACK of precision,
the delusion (or “pious fraud”) of the Eye Care Profession is that visual
acuity is “regulated by the brain.” Your eyes function similar to the pixels
receptors of a computerized video camera. The eye’s photoreceptors
not only allow you to see in color (primarily Red, Green, and Blue),
but the refresh rate of the photoreceptors, and the matrix stimulus of
the inner layer of neuroganglia by the photoreceptors, allows you to track
changes in the location of those images. However, the
neuroganglia layer of the retina “process” those photoreceptor responses in
clusters of about 20 photoreceptors much as a biological circuit board with
the emphasis on patterns of motion and proximity. The response of
about 100 photoreceptors, as combined by the neuroganglia, create the
stimulus for each optic nerve fiber going to the brain which, in turn,
creates vision and brings that image into focus. The comparative
focal depth of the Red, Green, and Blue
colors of the images also regulates the shape of the biological lens and
adjusts focal clarity in a process we call Chromatic Triangulation. The strobic stimulus of the spinning Black/White-on-Gray
Dyop gap/segments functions as a (binary) on/off switch to
stimulate the photoreceptors. As the stimulus area of the Dyop
gap/segment AREA becomes too small, that stimulus area becomes smaller
than the minimum AREA of photoreceptor visual
resolution. The angular arc width of the smallest diameter Dyop
ring detected as spinning creates an acuity endpoint to provide a precise,
accurate, and efficient method of measuring visual acuity. That precise acuity endpoint also creates
optimum values for sphere, cylinder, and axis (the above “Colenbrander
Optimum Dyop”) and aids in avoiding an overminused refraction. The retinal pixel process is similar to the
display of a television or your computer. Detecting the spinning
gaps/segments is similar to detecting the electronic
pixels. Computer pixels, like cone-photoreceptors, are so small
that, unless you are close enough, you only see lines or shapes and NOT
the pixels. As the spinning gap/segment area of
a Dyop gets too small due to the angular width of the ring getting
smaller, that gap/segment photoreceptor stimulus area becomes too small for
the photoreceptor clusters to detect that motion. That smallest Dyop stimulus
area detected as spinning creates a visual clarity threshold
(acuity endpoint) and is a cluster area of about 20
photoreceptors. That Dyop acuity and refraction endpoint is also
significantly more precise than staring at letters inherent in the Snellen test
because it is functionally about half the area (0.54 arc minutes squared)
than the 1.0 arc minute squared average Snellen stimulus area. The
ability to detect motion is also a survival tool as critical as detecting the
size of the image itself.
Color Acuity can
also be used for diagnostic tests. Basic Dyop
Blue Green Visual Screening Test Certain
Dyop color/contrast combinations can also be used to screen for potential
symptoms of dyslexia, migraines, and epilepsy. Rather
than accommodation being regulated by the length of the eye, the adjustment
as to accommodation is the learned response as to the comparative focal depth
for Red and Green. The
deceptive factor of Black/White acuity measurement is that
it masks the mechanics of accommodation regulation.
= = = = = = = = = = = = = = = = = = = = = = = = = = = = = = =
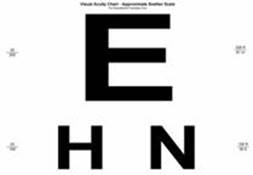
= = = = = = = = = = = = = = = = = = = = = = Brief
History of Historic Vision Measurement Thousands of years ago, visual clarity
(acuity) was defined by the ability to see the nighttime gap between two of
the smaller stars in the handle of the Big Dipper constellation.
In 1862 Dutch Ophthalmologist Herman
Snellen used the ability to identify (European) letters as the benchmark for
visual acuity. Reading had become a dominant economic and social
skill in Europe. Snellen used the convenience of black letters on
a white background as the benchmark although most of what we see is
NOT in black and white and other cultures use pictographs rather than
letter-based words. While twenty first century technology is letter-based
technology, today’s visual acuity is primarily measured by the clarity and
ability to read text on an electronic display. Unfortunately,
vision science has not kept up with the precision and demands of those 21st century
visual needs. The use of Dynamic
Visual Acuity to provide increased precision, increased consistency,
and increased efficiency of the Dyop® tests are intended as a global
replacement for Static Visual Acuity letter-based tests such
as Snellen, Sloan, and Landolt optotypes, and provide a more universal and
efficient method of vision measurement. = = = = = = = = = = = = = = = = = = = = = = = = = = = = = = =
= = = = = = = = = = = = = = = = = = = = = = Origin
of the Dyop® Concept
http://www.dyop.net/documents/Origin_of_Dyops.pdf A
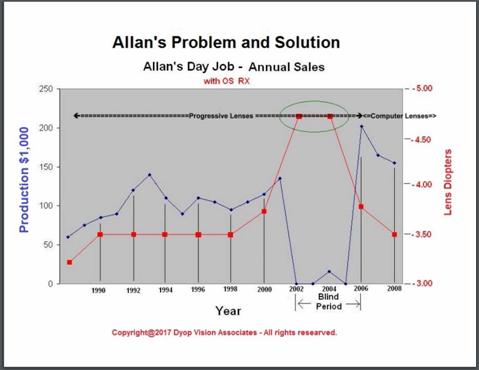
“Perfect Storm of repeated mis-prescriptions” led to the Dyop Tests
Allan's
Productivity - 1988 to 2008 This Dyop "personal research
history" is anecdotal. However, all of the discoveries and
research have been peer-review validated by academically trained optometry
professors. Their research was also provided at NO charge due to their
scientific curiosity and the potential of improving visual processes.
The goal of the anecdotal research has been having those discoveries
reproducible and simple enough so that they could be peer-review
validated. The nature of the discoveries and the scientific validation
has been stunning and delightful. The observations which followed over the
next ten years are from discovering how and why that consistent
Snellen-generated overminus occurred. = = = = = = = = = = = = = = = = = = = = = = = = = = = = = = =
= = = = = = = = = = = = = = = = = = = = = = It is easy to detect an image which needs a
more spherical lens power because it will appear blurry. It is
more difficult to detect an image which has too much spherical power because
the image will appear to be hyper-crisp. The advantage of a Dyop
test versus static images is that the Dyop arc width diameter will reach a
minimum when the combination of the optimum sphere, cylinder, and axis is
achieved. The
inherent tendency to fixate on static images during vision testing tends to
result in a measurement with excess visual sphere. Eyeglass and
contact wearers tend to NOT be aware of their overminus. The "optimum" Dyop rotation rate
seems to be a 7.6 arc minute and the "optimum" stroke width seems
to be 40 rpm for a Dyop 20/20 acuity endpoint. The
"optimum" Dyop stimulus area equivalent to a Snellen 20/20, or Metric
6/6, acuity and refraction endpoint is 0.54 arc minutes squared, or the
equivalent of about 20 photoreceptors. That "optimum" 0.54 arc minute
squared stimulus area at a 40-rpm rotation speed creates a photoreceptor
refresh rate (much like the shutter speed of a camera) of 0.33 arc minutes
squared per second. Dyop
vs. Snellen Comparison A
comparison of the Dyop test vs. the Snellen/Sloan/Landolt tests leads to the
following conclusions as to the flaws inherent in Snellen-type
letter-based vision testing. 1. The
stimulus seen by the color-perceptive cone photoreceptors in the retina
foveal area is a two-dimensional AREA rather than a
one-dimensional value of height as defined by Snellen. 3. Dyop acuity and refraction
measurement is based on the more precise RESOLUTION Acuity of the eye
rather than the culturally dependent and subjective RECOGNITION Acuity
as interpreted by the eye care examiner. 4. The (empirically determined) optimum
Dyop stimulus AREA is 0.54 arc minutes squared. The
assumed Snellen/Sloan/Landolt tests have a theoretical stimulus AREA of
1.0 arc minute squared, which is almost two-fold excess size of the
Snellen stimulus AREA.
That bloated assumed stimulus AREA is the reason for
static-letter-based tests having a logarithmic increase in size or viewing
distance with a linear increase in diopters of blur whereas the (empirically
determined) Dyop stimulus AREA has a linear diameter
increase with a linear increase in blur and/or viewing distance. 5. Acuity and cognition are separate
components of vision. The physiological Resolution Acuity
response to the Dyop test eliminates the Recognition Acuity cultural
bias of European letters as well as increases the consistency and
universality of the Dyop response.
Dyop acuity and refraction testing is up to six times more precise than
Snellen testing, up to eight times more consistent, and up to three times more
efficient. Dyop testing can also be
used in non-literate individuals, children, and infants, and can be used to
measure acuity in color for diagnostic and potential therapeutic purposes. 6. Motion detection is an inherent
facet of acuity. Motion detection can be used in infants and
non-literate adults to determine the acuity endpoint as the smallest stimulus
where that motion is still detected. The actual 0.54 arc minute
squared MAR stimulates only about 20 photoreceptors, so that about five
clusters of Dyop stimulus (100 photoreceptors) result in the stimulus
generated for the response of each optic nerve fiber. 7. “Identically sized” (height) letter-based
static optotypes do not have an identical visual response due to their
irregularity. Individuals habituated to the hyper-crispness of
electronic images, due to the Stiles-Crawford effect, tend to respond
differently to fuzzy optotypes in wanting to maximize the black/white
contrast by having the examiner increase the visual power. That
“excess minus power” is likely a factor in the 21st century Global
Epidemic of Myopia. 8. The response of the cone-photoreceptors
is a transient bioelectrical stimulus from specific wavelengths of
light. As a result, static optotype image fixation depletes the normal
photoreceptor refresh rate (calculated to be 0.33 arc minutes squared per
second) leading to visual stress, reduced acuity, and an overminused
refraction. 9. Accommodation is a learned
response based on the focal depths of Red, Green,
and Blue in
relation to the retina, rather than a cerebral process. The regulation
of acuity (accommodation) is reflected in the variances in Dyop color
acuity which validates that is a color perception function, which we
define as Chromatic Triangulation. 10. Not all trichromats have the same
ratio of Red/Green
photoreceptors. Variations in trichromat response are associated with
chromatin-associated maladies such as dyslexia, migraines, and epilepsy
(primarily a 75% Red and 20%
Green
ratio versus a less stressed Red/Green
ratio (50% Red and 45%
Green). 11. Variances in color acuity are
genetic in origin and have a cultural/psychological effect on an
individual. The predatory advantage of a Stable
Distance Image, for individuals
with high-red photoreceptor ratios, contributes to Near
Vision Stress and individuals with a tendency for
chromatic stress related maladies such as dyslexia and migraines, a
psychological preference toward a more structured (authoritarian) environment,
and visual compensation with excess confidence resulting in the
Dunning-Krueger Effect. An ADDED problem of NOT
having Optimum Acuity/Refraction is that it impairs cognition as well as
vision. https://www.dyop.net/dyslexia-default.htm We
are NO LONGER in the Age
of Information or the Age
of Information Overload. We are now in the Age
of Comprehension. Since using the Snellen test consistency
increases the myopic power of a refraction, that myopic increase also
contributes to the increase in global myopia and a loss of cognition. The scientific and commercialization
benefits of the Dyop concept are due to its increased precision, consistency,
efficiency, and broader range of vision test attributes, and universal
patient acceptance versus "conventional" (1862)
static-letter-visual testing. “Any
sufficiently advanced technology is indistinguishable from magic.” “Technology
is our word for stuff we don’t understand.” Technology
is the use of increasingly accurate, self-evident, and reproducible
information to replace time, energy, and matter. The
benefit of technology is NOT in what it lets people accomplish, but in
how it improves the character of people. ----------------------------------------------------------------------------------------------------------------------------------------- The
Dyop® (Dynamic Optotype™) tests and concept are covered under U.S. Patent US
8,083,353 and International
Published Patent WO 2011/022428. kFor further
information contact: Allan Hytowitz at Allan@DyopVision.com 5035
Morton Ferry Circle, Johns Creek, GA, 30022
/ 404-281-7798 Copyright
©2024 DyopVision™ Associates. All Rights Reserved. |


